Two industries can sell to the same millions of consumers and still earn very different returns. In Aswath Damodaran's January 2026 industry data, US-listed soft drink makers kept a 13.40% net margin, while US-listed air transport companies kept 2.51%, about a fifth as much. Industry structure explains the gap, and industry analysis is how you read it.
Industry analysis is the structured study of how an industry makes money: its size, concentration, entry barriers, buyer and supplier power, substitutes and direction of change. Analysts define the industry, size it, measure its structure, score the competitive forces, scan the external environment and monitor signals, then state what the result means for a specific decision.
This guide covers the six steps, the data sources behind each one, and a worked example. The example uses live company and news data from akta.pro, queried on November 5, 2026, to analyze US private companies in AI drug discovery.
What is industry analysis?
Industry analysis is the study of the economic structure and trends of one industry, done to judge how attractive it is and where a company or investor should position. It answers questions about the whole group of firms that serve the same buyers, rather than about any one firm.
People use it for market entry decisions, investment screening, due diligence, strategy reviews, sales territory planning and pricing. The output is a judgment: how profitable the industry can be, what could change that, and what to do about it.
It sits next to three neighboring analyses that people often confuse with it.
| Analysis | Unit studied | Main question | Typical output |
|---|---|---|---|
| Industry analysis | A group of firms serving the same buyers | How profitable can this industry be, and why? | Structure assessment, force scores, outlook |
| Market analysis | Demand and customers | How big is demand and who buys? | Market size, segments, growth |
| Competitor analysis | Named rivals | What will specific rivals do? See how competitor analysis differs from industry analysis. | Rival profiles, positioning |
| Company analysis | One firm | How well does this firm exploit its industry? | Strengths, valuation, forecasts |
In practice, the industry view comes first, because it sets the range of outcomes any firm inside it can reach.
The industry analysis method in six steps
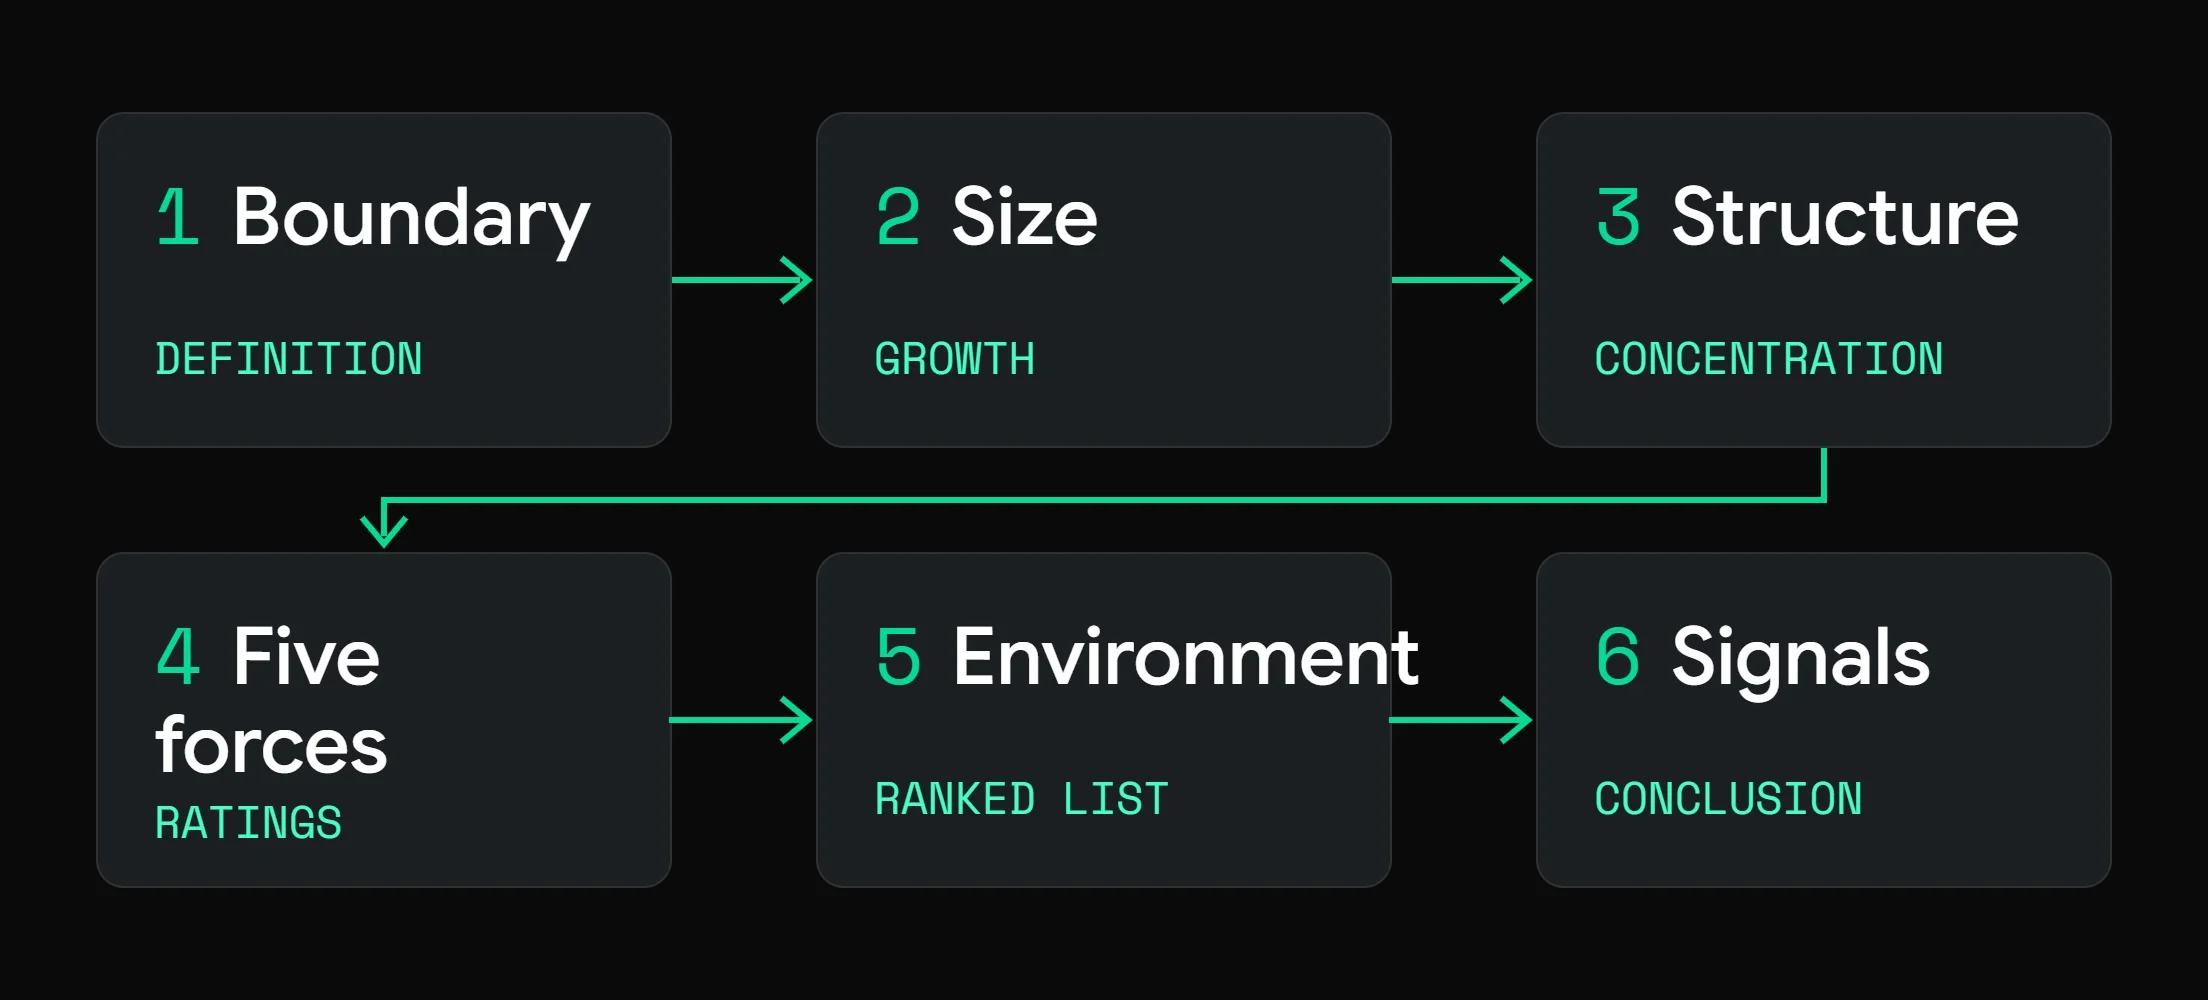
The method has six steps, and each one produces a specific output you can check.
-
Define the boundary. Output: a written industry definition and a list of companies that fit it.
-
Size the industry and place it in its life cycle. Output: revenue or company counts, growth rate, life cycle stage.
-
Measure structure. Output: concentration, entry flow, capital intensity and profit benchmarks.
-
Score the five forces. Output: a rating per force, each with one number and one source.
-
Scan the external environment. Output: a short ranked list of outside factors that change a force.
-
Monitor signals and conclude. Output: a dated conclusion, plus the signals that would change it.
Frameworks are tools inside these steps. This table shows which framework answers which question, so you pick by question rather than by habit.
| Question | Framework | Used in step |
|---|---|---|
| Why is profit high or low in this industry? | Porter's Five Forces | 4 |
| Which outside forces will change the industry? | PESTEL | 5 |
| What stage is the industry in? | Industry life cycle | 2 |
| Where in the chain does the margin sit? | Value chain analysis | 3 |
| Where does my firm stand given all of this? | SWOT | After step 6, at firm level |
Step 1: Define the industry boundary
A good boundary names the buyers, the need served and the geography, in one sentence. "Retail" is too wide to analyze. "Off price apparel retail in the United States" is usable.
Start from a classification code, then check it. The North American Industry Classification System (NAICS) classifies establishments "by their type of economic activity," according to the Bureau of Labor Statistics. The Census Bureau is phasing the 2022 version in across its economic programs, and the Office of Management and Budget has published proposed 2027 updates, so confirm the vintage of any dataset you pull. The SEC assigns each filer a four digit code from its own Standard Industrial Classification list.
Codes miss companies and include wrong ones. A DePaul University library guide warns that "companies determine which SIC/NAICS classification should describe them." The same applies to commercial taxonomies, as the worked example below shows.
Test the boundary with three questions:
- Who pays, and would they treat these firms as interchangeable?
- What do those buyers consider instead, inside or outside the list?
- Which firms could serve the same buyers within 12 months?
If the answers contradict the code, trust the answers and adjust the list.
Step 2: Size the industry and place it in its life cycle
Size the industry two ways and compare. Top down uses official revenue or establishment counts for the matching NAICS code, such as those in the Census Bureau's Economic Census. Bottom up multiplies the number of companies by typical revenue per company. As a rule of thumb, a large gap between the two points to a boundary problem.
Then place the industry in its life cycle: introduction, growth, maturity or decline. Growth tells you where the industry is, not whether it is profitable. Check margins and structure before you call a fast growing industry attractive.
Step 3: Measure structure
Structure is what the forces act on. Measure four things.
Concentration. Share of revenue held by the top four firms (CR4), or the Herfindahl-Hirschman Index, the sum of each firm's squared market share:
HHI = Σ (s_i)² for i = 1 to n
where s is each firm's market share in percentage points. Higher values mean fewer firms hold more of the market.
Entry flow. Count companies by founding year. A steady stream of new firms means barriers are low somewhere in the chain.
Capital intensity. Group companies by total funding raised. A thin top tier with a long tail means success requires far more capital than entry does.
Profit benchmarks. Compare margins with other industries. Damodaran's January 2026 US table gives a quick read:
| Industry (US listed firms) | Firms | Net margin | Pre-tax operating margin |
|---|---|---|---|
| Retail (Grocery and Food) | 15 | 1.32% | 1.85% |
| Air Transport | 23 | 2.51% | 4.88% |
| Drugs (Biotechnology) | 496 | -5.00% | 8.76% |
| Beverage (Soft) | 27 | 13.40% | 20.63% |
| Drugs (Pharmaceutical) | 228 | 18.54% | 29.54% |
| Software (System and Application) | 309 | 25.49% | 33.21% |
| Total market | 5,994 | 9.74% | 12.75% |
Source: Damodaran Online, Revenue Multiples by Sector (US), data as of January 2026. Biotechnology and pharmaceutical firms sit in the same broad field and show a 23.5 point net margin gap, which is the kind of difference step 4 is built to explain. The table shows the gap, not its cause.
Step 4: Score the five forces with evidence
Porter's five forces are rivalry among existing firms, threat of new entrants, bargaining power of buyers, bargaining power of suppliers, and threat of substitutes. Together they shape how much of the value an industry creates stays with the industry.
The common failure is scoring from intuition. Use an evidence standard: a rating is allowed only with one number and one named source behind it. If you cannot find the number, leave the force unscored and name the gap.
| Force | Question | Evidence to collect | Where to look |
|---|---|---|---|
| Rivalry | How hard do existing firms fight for the same buyers? | Number of firms, size spread, price discounting, differentiation claims | Company lists, filings, news |
| New entrants | How easily can new firms start and compete? | Founding counts per year, capital needed to compete, regulation | Company lists with founding year and funding |
| Buyers | Can customers dictate price and terms? | Buyer concentration, share of revenue from top customers, in house alternatives | Filings, customer disclosures, partnership news |
| Suppliers | Can inputs be priced or withheld? | Supplier concentration, input cost trend, switching cost | Procurement data, supplier filings |
| Substitutes | What else meets the same need? | Alternative products, price per unit of benefit, adoption trend | Trade press, pricing pages, adoption data |
Rate each force low, medium or high, then write one sentence that cites the evidence. Base the conclusion on the one or two strongest forces rather than averaging all five.
Step 5: Scan the external environment and rank what matters
PESTEL covers political, economic, social, technological, environmental and legal factors. List the ones that apply, then keep only those that change a force from step 4. A tariff that raises supplier power belongs on the page. A trend with no path to any force does not.
Rank what remains by impact and likelihood, and put a date or trigger beside each. "New EU rule effective 2027" is checkable. "Regulation may tighten" is not.
Step 6: Monitor signals and write the conclusion
An industry analysis starts aging the day it is written. IBISWorld's analysts note that "past industry analysis can become outdated extremely quickly," so the last step builds the update into the work.
Pick the signal types that map to your forces and track them. Funding rounds and new entrants feed the entry and rivalry scores. Partnerships and customer deals feed buyer and supplier power. Mergers change concentration. Regulatory approvals and legal proceedings change the rules. A news taxonomy with event type tags makes this countable. See how to monitor private company news with an API and the news signals API for a setup.
Then write the conclusion in four parts: the verdict on industry attractiveness, the one or two forces that drive it, the evidence behind them, and the specific signals that would change your mind. Date it.
Industry analysis data sources and what each one cannot see
The main free sources are the Census Bureau, the Bureau of Labor Statistics, SEC EDGAR and Damodaran Online. Paid sources add forecasts and private company coverage. Each has a blind spot, and the worst one is that most free sources only see public companies.
| Source | What it gives you | Private companies? | Cost | Main limit |
|---|---|---|---|---|
| Census Bureau Economic Census and NAICS tables | Establishment counts and revenue by NAICS code | Yes, as aggregates | Free | Five year cycle, broad code definitions |
| Bureau of Labor Statistics | Employment series by NAICS industry | Yes, as aggregates | Free | No company level view |
| SEC EDGAR | 10-K business and risk sections, financials, SIC codes | No | Free | Registrants only |
| Damodaran Online | Margins, multiples, betas by industry, updated each January | No | Free | Listed firms, annual snapshot |
| IBISWorld and similar syndicated reports | Market size history, forecasts, ready made structure notes | Partly | Subscription | Fixed industry definitions you cannot change |
| Trade associations and journals | Segment detail, adoption data | Varies | Free to paid | Uneven quality and coverage |
| Primary research | Buyer behavior, pricing, switching intent | Yes | Time and fees | Small samples, slow |
| akta.pro company data and news signals | Firmographics, funding, investors and dated event signals for 20M+ companies, with list building by industry code | Yes | Pay as you go | Taxonomy codes need checking, news counts are directional |
The blind spot matters most in young industries. Damodaran's US table covers 5,994 listed firms in total, and EDGAR covers registrants only. A single niche code in akta.pro's taxonomy, AI and machine learning platforms for drug discovery, returned 500 or more US private companies in the worked example below. The definitions differ, so the numbers are not comparable one to one, but the order of magnitude shows why a public data only analysis would miss most of the players. For clean company lists, entity resolution matters too: see why company names collide across datasets and what firmographic data includes.
Worked example: industry analysis of US AI drug discovery
This example runs the six steps on US private companies in AI drug discovery. The goal is a decision grade view for an investor or a pharma business development team deciding where to look.
Method and data. All counts were queried from akta.pro on November 5, 2026. The company universe uses the List Generation API with industry code HLAGAJAO (AI and ML platforms for drug discovery and experiment optimization), company type private and headquarters in the United States. Founding year and total funding come from akta.pro firmographic and funding fields. Signal counts use the news signals API with the same industry code, a window of August 7 to November 5, 2026, high relevance articles only and near duplicates grouped. Company counts above 500 are capped by the API and shown as "500 or more." Counts reflect recorded data, so companies with missing founding years or funding amounts are excluded from the matching table.
Steps 2 and 5 are left out of the example. Sizing needs revenue data that private companies rarely disclose, and the environment scan would repeat points covered in the guide above. The results shown are for steps 1, 3, 4 and 6, where the dataset gives direct evidence.
Step 1 result: the code is a starting list, not the industry
The code returned 500 or more US private companies. The top 30 by total funding mixed true AI drug discovery firms with neighbors such as Unchained Labs (lab automation hardware) and Paige (digital pathology software), and the wider set included Medidata (clinical trial software). These sell to the same research buyers, but their economics differ from model and platform companies. A careful analyst would split the list before scoring forces. Here the full set is kept so the structure counts stay reproducible, and the finding is stated: the boundary is soft.
Step 3 result: a thin top tier and a long tail
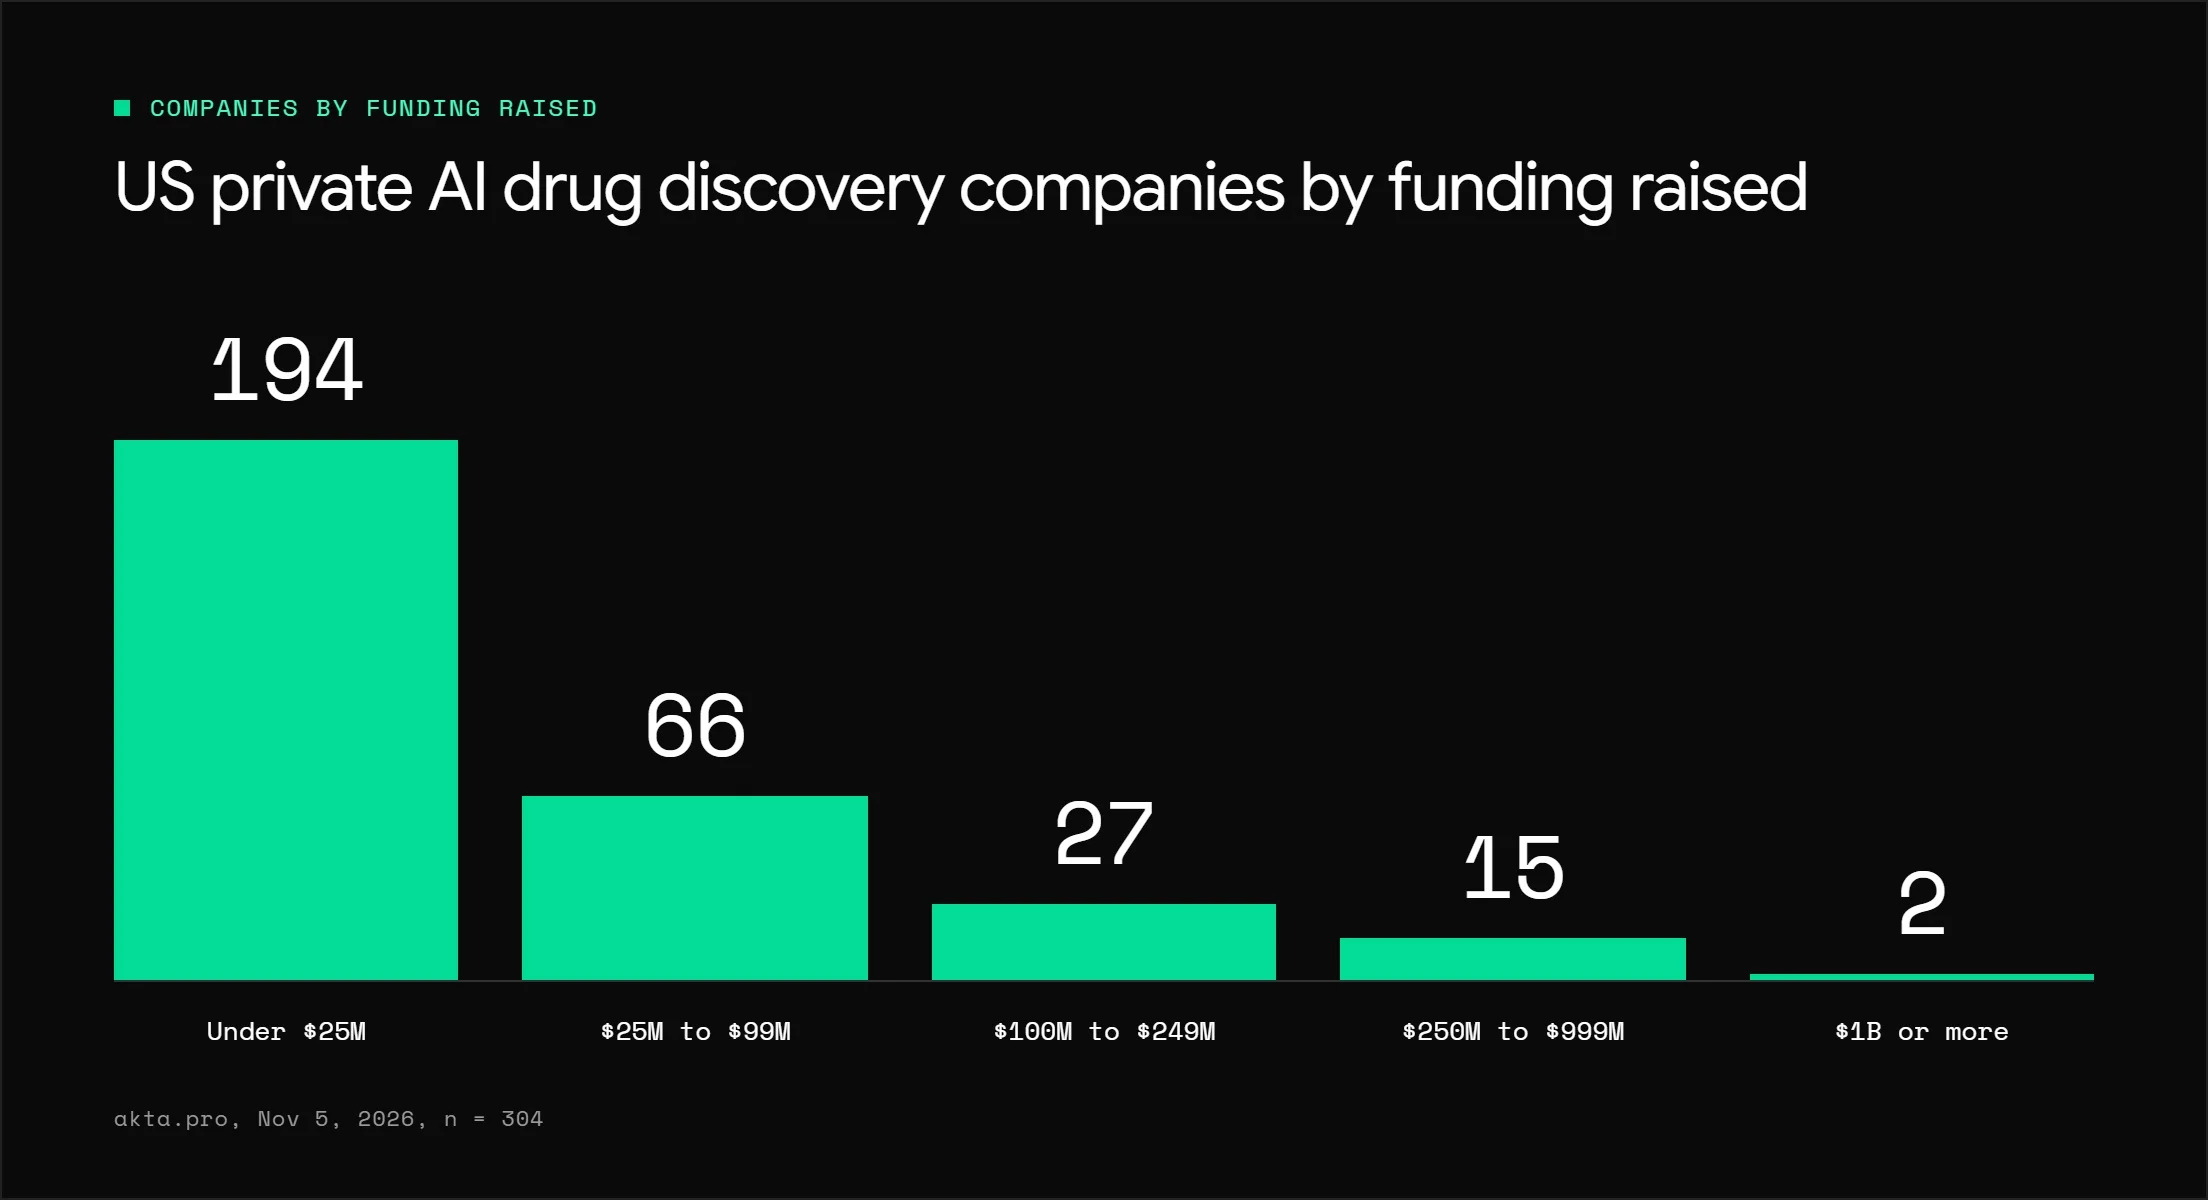
Of the 304 companies with recorded funding, 17 (5.6%) have raised $250 million or more, and 194 (63.8%) have raised under $25 million.
| Total funding raised | US private companies | Share of 304 |
|---|---|---|
| $1 billion or more | 2 | 0.7% |
| $250 million to $999 million | 15 | 4.9% |
| $100 million to $249 million | 27 | 8.9% |
| $25 million to $99 million | 66 | 21.7% |
| Under $25 million | 194 | 63.8% |
Entry has continued at a steady pace. Counting companies by founding year in the same universe gives:
| Founding years | Companies | Average per year |
|---|---|---|
| 2015 to 2018 | 127 | about 32 |
| 2019 to 2022 | 190 | about 48 |
| 2023 to 2026 (2026 incomplete) | 174 | about 44 |
The top of the funding table shows how high the bar can go. Xaira Therapeutics, founded in 2023, launched in April 2024 with a $1 billion Series A led by ARCH Venture Partners and Foresite Capital, with 13 investors in the round, according to akta.pro company data. It is described there as pre revenue, with a sales led go to market aimed at large pharmaceutical partners.
Step 4 result: three forces scored, two left open
| Force | Rating | Evidence | Source |
|---|---|---|---|
| Rivalry | High | 44 firms have raised $100 million or more, and 15 sit between $250 million and $999 million, many pursuing the same pharma partners | akta.pro funding bands, November 5, 2026 |
| New entrants | Medium to high | 174 companies founded 2023 to 2026, so starting is cheap. Competing at the top took $1 billion in one round at Xaira | akta.pro founding years and company data |
| Buyers | High | Revenue models point to collaborations, milestones and royalties from large pharma. Buyers also build outside startups: BSC and AstraZeneca signed a supercomputing and AI agreement in October 2026 | akta.pro company data, HPCwire |
| Suppliers | Not scored | Compute and data pricing is not in the dataset | Gap: needs compute and data vendor pricing |
| Substitutes | Not scored | Conventional discovery and contract research alternatives are not measured here | Gap: needs price per candidate and adoption data |
The ratings for rivalry, entrants and buyers are analyst judgments built on the counts. The buyer rating also rests on one company profile and one partnership, so treat it as a hypothesis to test with more deals.
Step 6 result: capital and deals dominate the news
| Signal type (akta.pro tag) | Signals, Aug 7 to Nov 5, 2026 |
|---|---|
| Partnerships and alliances | 503 |
| Equity fund raising | 308 |
| Product launches and enhancements | 286 |
| Mergers and acquisitions | 90 |
| Regulatory approvals and certifications | 14 |
| Workforce reductions and financial distress | 2 |
Partnership signals outnumber approvals and certifications by about 36 to 1. Read narrowly, that pattern fits an industry still in the proof phase: value is being claimed through deals and funding, with few regulatory outcomes yet. The caveat is scope. The industry filter is global and not limited to US private companies, and tangential items appear. A consumer goods R&D investment and a government agency meeting were tagged as partnerships, and one of the two distress items concerned an education company. Sample the articles before quoting any count, and see the company news retrieval benchmark for how akta.pro measures noise in news retrieval.
The written conclusion
As of November 5, 2026, US AI drug discovery looks like a barbell. A few very large rounds sit at one end and a long tail of small companies sits at the other, with entry continuing at about 44 new companies a year. Rivalry and buyer power are the forces most likely to cap profit, because many funded firms compete for a small set of large pharma partners who can also build capability elsewhere. Two forces, suppliers and substitutes, remain unscored. Signals that would change this view: a rise in approvals and certifications relative to partnerships, a fall in founding counts, or consolidation that shows up as a jump in acquisition signals.
Five mistakes that make an industry analysis wrong
-
Reading growth as profit. Growth is the most quoted number in most industry analyses and often misleading on its own. A fast growing industry can still be unprofitable. Check margins and the strongest force before you call an industry attractive.
-
Treating a classification code as the industry. Self assigned codes miss firms and add outsiders, as the worked example showed. Read the companies a code returns.
-
Using public data for a private industry. EDGAR and Damodaran cover listed firms. If most players are private, the structure you measure is the structure of the firms that went public.
-
Scoring forces from intuition. A rating with no number behind it cannot be challenged or updated. Leave the force unscored and name the gap.
-
Writing it once. Without a dated conclusion and named signals, nobody knows when the analysis stopped being true.
Frequently asked questions
What is the purpose of industry analysis?
Its purpose is to judge how attractive an industry is and what drives its profit, so a company or investor can decide where and how to compete. It supports market entry, investment screening, due diligence and strategy reviews.
What are the main methods of industry analysis?
The main methods are Porter's Five Forces, PESTEL analysis, SWOT analysis, the industry life cycle and value chain analysis. Five Forces explains industry profitability, PESTEL covers outside factors, and SWOT applies the findings to a single firm.
How do you do an industry analysis for private companies?
Follow the same six steps, but build the company universe from private company data rather than filings. Define the boundary, list the companies, then count them by funding and founding year to measure structure. Track news signals to see deals and entry in time.
Is industry analysis part of fundamental analysis?
Yes. Fundamental analysis usually starts at the economy, moves to the industry and ends at the company. The industry step sets the range of margins and growth a company can reasonably reach.
How often should you update an industry analysis?
Update the structure measures when the underlying data refreshes, such as Damodaran's January tables or a new Economic Census release. Review the signal counts monthly in fast moving industries. Re-date the conclusion each time.